The mobile app economy hit record highs in 2025 and shows no sign of slowing in 2026. Consumers spent 5.3 trillion hours in apps, in-app purchase revenue reached $167 billion, and non-game apps out-earned games for the first time in history. The mobile app development services market itself stands at roughly $145 billion, with projections pointing toward $776.9 billion by 2035. This guide compiles 100+ mobile app development statistics from Sensor Tower, Adjust, AppsFlyer, StatCounter, and other primary sources, covering market size, usage, revenue, development costs, retention benchmarks, and the trends defining 2026.
Here is a number worth sitting with: people spent 5.3 trillion hours inside mobile apps in 2025. That works out to about 3.6 hours per day for every mobile user on the planet, or more than 13 minutes of every waking hour.
If you are a founder, product manager, or business owner weighing an app investment, these mobile app development statistics are more than trivia. They tell you where users spend their attention, what they pay for, how much a build actually costs, and how hard retention really is. Numbers like these separate a confident product decision from an expensive guess.
Every figure below links to its original source, not to another blog quoting one. We re-checked each one in July 2026 and flagged the places where data providers disagree.
Let’s get into the data.
Key Mobile App Statistics 2026: Editor’s Top Picks
Short on time? These ten mobile app statistics for 2026 capture the state of the industry:
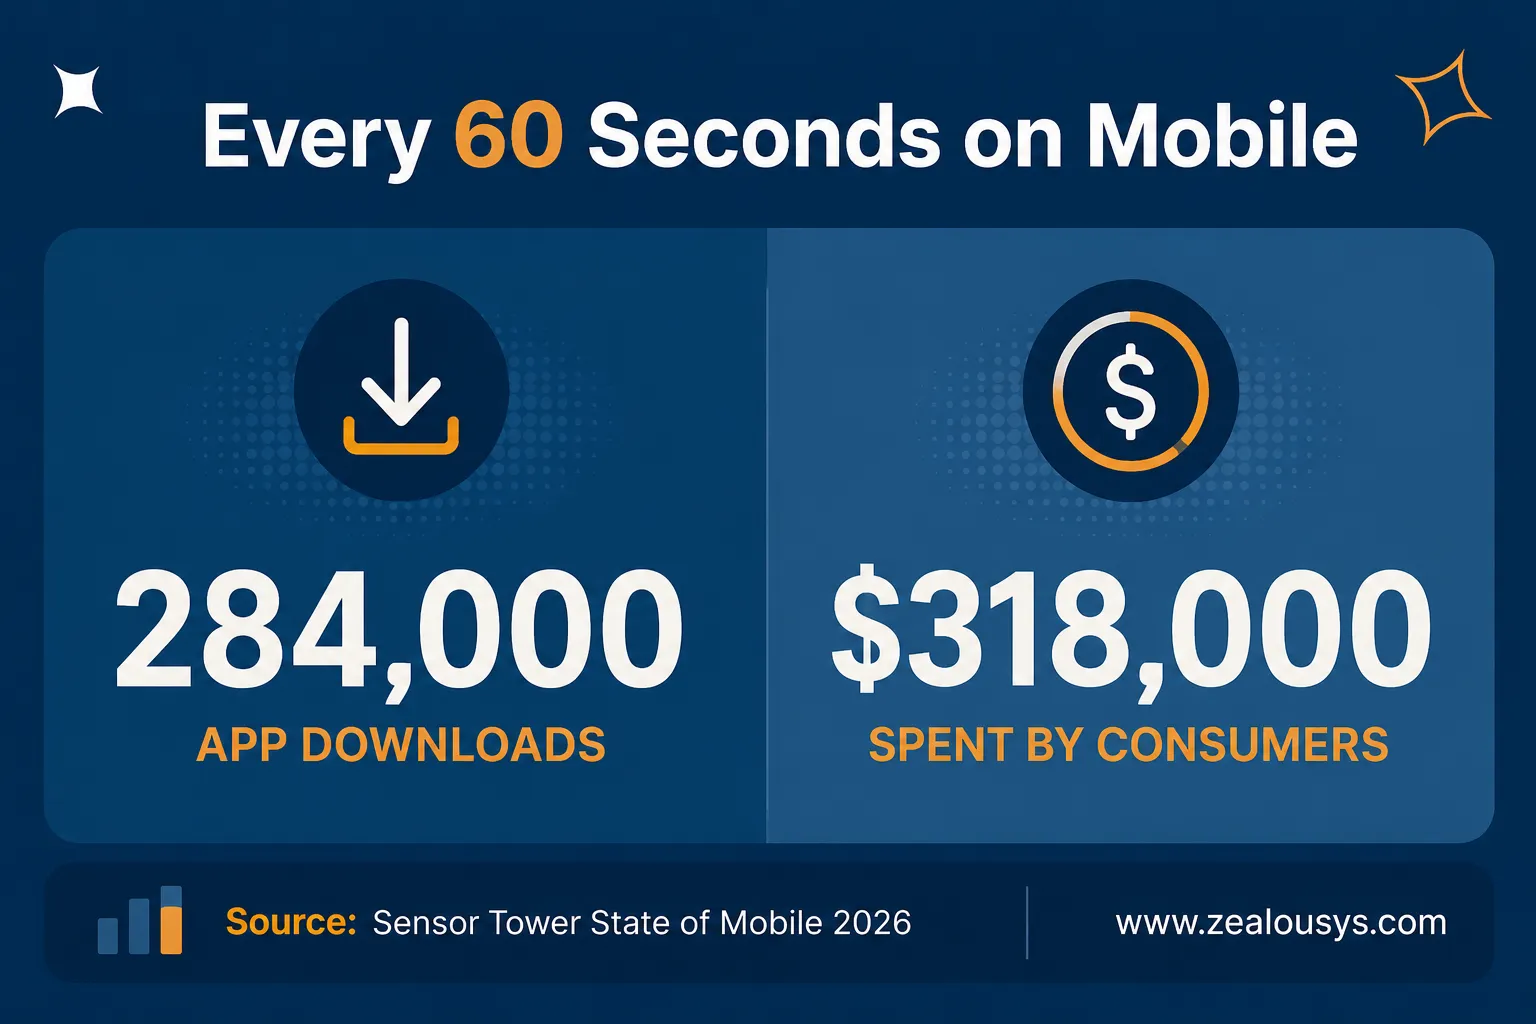
Global in-app purchase (IAP) revenue reached $167 billion in 2025, up 10.6% year over year, with $318,000 spent every minute.
Consumers spent 5.3 trillion hours in apps, roughly 3.6 hours per day per user and over 600 hours for every person on Earth.
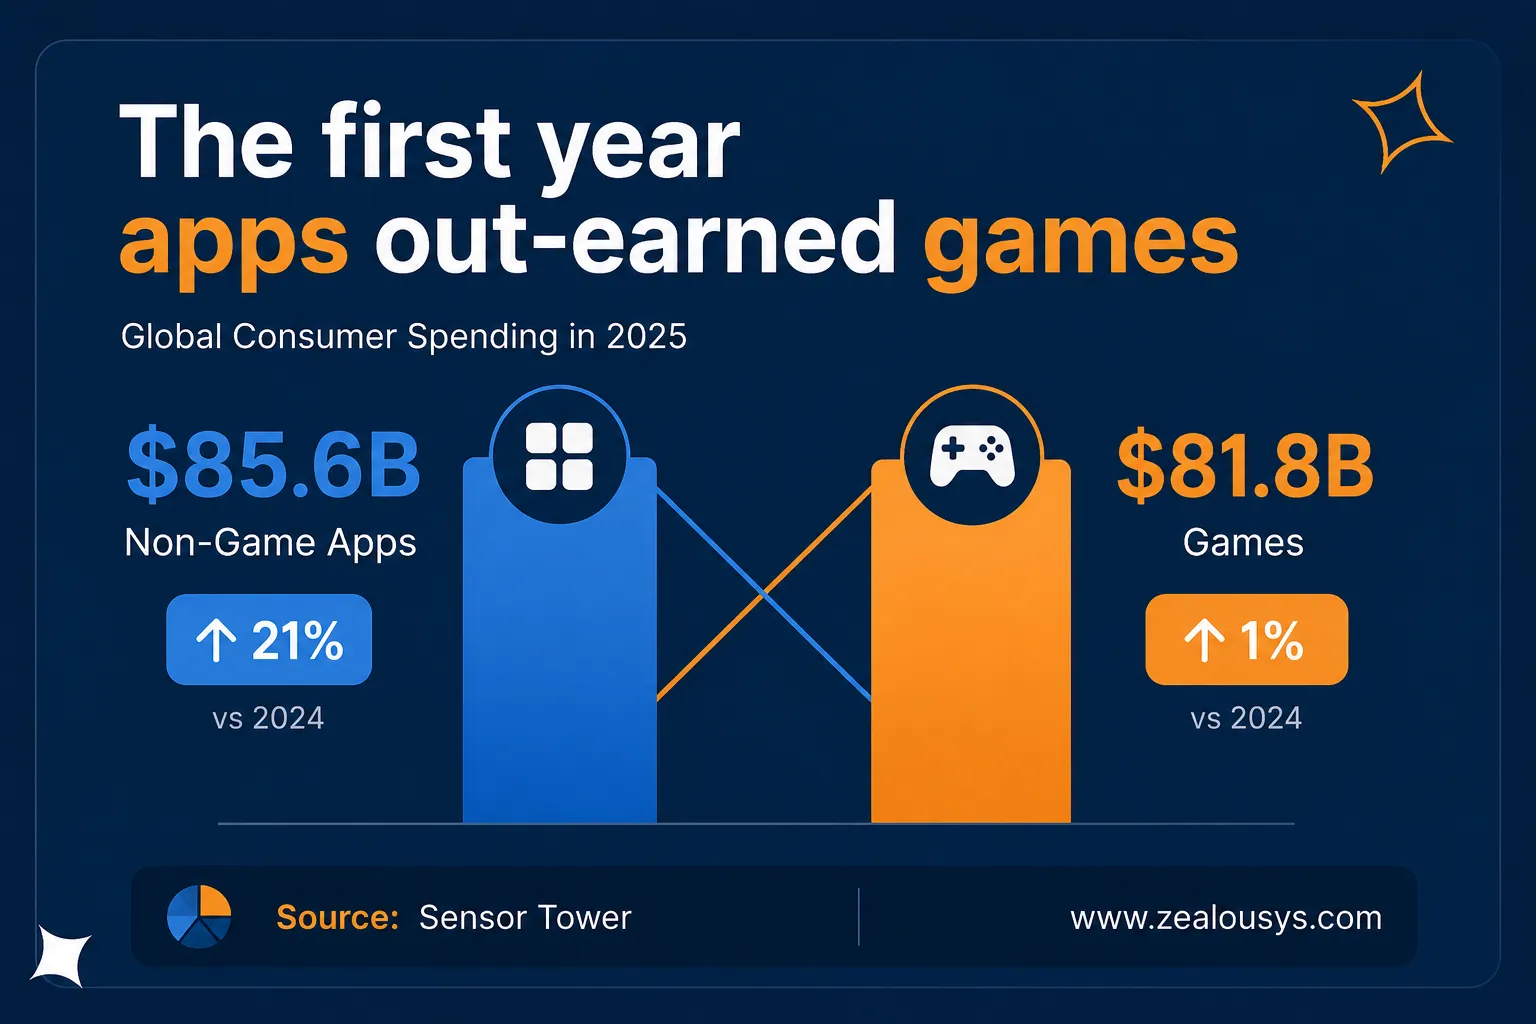
For the first time ever, non-game apps ($85.6 billion) out-earned games ($81.8 billion) in consumer spending.
Global app downloads hit 149 billion in 2025, averaging 284,000 installs every minute.
The mobile app development services market was valued at $145.05 billion in 2025 and is projected to reach $776.9 billion by 2035 at an 18.25% CAGR.
Android holds about 68% of the global mobile OS market; iOS holds roughly 32%, per StatCounter data from May 2026.
Apple’s App Store captured about 70.5% of combined store consumer spending: $117.6 billion versus Google Play’s $49.2 billion.
The median cost of professionally developed custom apps sits around $171,450.
Average Day 30 retention across all app categories is just 7%, per Adjust benchmarks.
ChatGPT became the fastest app in history to pass $3 billion in annual revenue, generating $3.4 billion in 2025.
Now let’s break these down section by section.
Mobile App Market Size and Growth Statistics
The headline numbers first. Among all mobile app development statistics, market size is the one most often quoted out of date. The mobile app market has moved past its land-grab phase. Growth in downloads has flattened, but revenue keeps climbing, which tells you the market now rewards monetization and product quality over raw install volume.
Global App Economy Value and Projections
The global mobile app development market (the services and platforms used to build apps) reached $145.05 billion in 2025 and is forecast to hit $776.9 billion by 2035, an 18.25% CAGR.
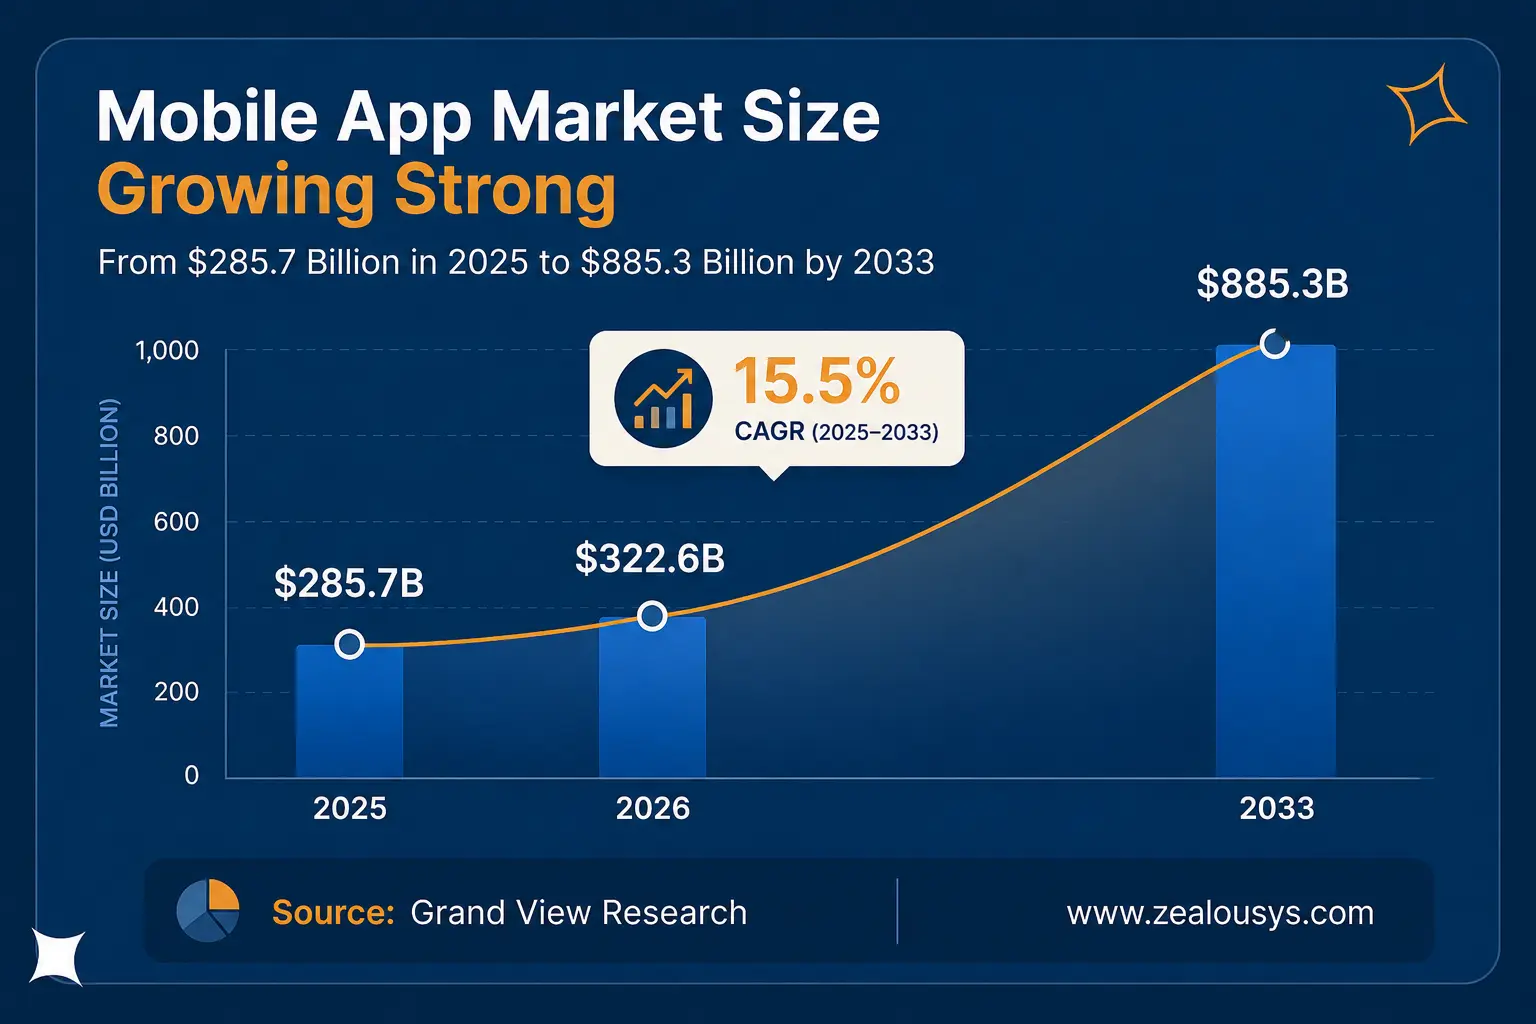
The broader mobile application market (all app-generated revenue) stood at $285.7 billion in 2025 and is projected to grow from $322.6 billion in 2026 to $885.3 billion by 2033, a 15.5% CAGR, per Grand View Research‘s July 2026 update.
Global in-app purchase revenue hit $167 billion in 2025, up 10.6% year over year, an all-time high.
Consumer spending on non-game apps grew 21% year over year to $85.6 billion, nearly 2.8x the amount spent five years earlier.
Apple reported that the App Store ecosystem facilitated $1.4 trillion in developer billings and sales in 2025, with more than 90% of it flowing to developers commission-free.
Download growth has essentially plateaued: total downloads rose just 0.8% year over year to 149 billion, while revenue grew more than ten times faster.
Fifteen of the top 20 non-game subgenres delivered IAP revenue growth of at least 10% in 2025.
The market remains top-heavy: the top 1% of publishers captured 92% of IAP revenue and 81% of downloads in 2025, though the bottom 99% is growing its share, helped by generative AI lowering development barriers.
In total, 18 apps surpassed $1 billion in annual IAP revenue in 2025, split evenly between games and non-games.
The demand base keeps expanding: 5.83 billion people use a mobile phone (70.4% of the global population), and 7.65 billion smartphones are in use, per DataReportal.
What this means for you: the market is mature, not saturated. New apps still break out every year, but they win on engagement and monetization, not novelty. Budget accordingly.
App Usage Statistics: How People Use Apps in 2026
Attention is the real currency of mobile, and these app usage statistics show exactly where it goes.
How Much Time Do People Spend on Mobile Apps Daily?
The average user spent 3.6 hours per day in apps in 2025, up 1.1% year over year.
Total time spent in apps reached 5.3 trillion hours, a 3.8% annual increase, averaging over 600 hours per person on Earth.
Social apps dominate attention: users spent nearly 2.5 trillion hours on social media apps in 2025, more than 90 minutes per user per day.
More than 60% of all mobile time is spent inside social media and social messaging apps.
Time spent in the US rose a modest 4% year over year, a slight rebound after signs of digital fatigue in 2024.
Apps, not browsers, own the phone: eMarketer puts apps at roughly 88% of US mobile time, and Comscore has measured up to 90% of mobile minutes happening in-app. If your mobile strategy is a responsive website, you are competing for the leftover tenth.
Average Apps Installed and Used Per Device
The average user engaged with 34 different apps per month in 2025, up 5.4% year over year.
On a daily basis, people typically use about 10 unique apps.
Mobile App Download Statistics by Country
Global downloads reached 149 billion in 2025, or 284,000 installs per minute.
India led the world with 25.5 billion downloads in 2025, with the United States and Brazil rounding out the top three, per Sensor Tower.
India and Pakistan were the only two top 10 markets to post positive download growth in 2025.
By revenue, the US is the clear leader: consumers there spent nearly $60 billion in 2025, with Western Europe led by the UK, Germany, and France.
By category, games led downloads with 34.54 billion installs (30.8% of the total), followed by entertainment (10 billion) and finance (6.8 billion), per AppTweak.
What this means for you: download-heavy markets and revenue-heavy markets are different places. If your model depends on paid subscriptions, the US, Western Europe, and Japan matter far more than raw install counts suggest.
App Store Statistics: iOS vs Android
The two-store duopoly is alive and well. Together, iOS and Android control over 95% of app distribution outside China. But the stores behave very differently, and these app store statistics explain why platform choice still keeps founders up at night.
How Many Apps Are on the App Store and Google Play in 2026?
As of mid-July 2026, 42matters’ live tracker counts approximately 2.45 million apps on Google Play and 2.47 million on the Apple App Store (these figures update daily).
Free dominates both stores: Google Play lists about 2.37 million free apps versus roughly 72,000 paid (97% free), while the App Store lists 2.34 million free and 124,000 paid.
Games make up 277,000 titles on Google Play and 236,000 on the App Store; the rest are non-game apps.
The release pace is relentless: 94,370 Android apps and 120,792 iOS apps were published in the last month alone, over 5,000 new store releases per day.
Apple added approximately 557,000 new apps in 2025, a 24% increase over the prior year, and counts over 800,000 active publishers.
Google has removed roughly 1.8 million low-quality, spam, or policy-violating apps from Google Play since 2024, per Appfigures-based reporting. Because of this cleanup, some trackers now count Play’s catalog at closer to 1.8 million, so app-count figures legitimately vary by methodology.
The App Store attracts more than 850 million average weekly users across 175 countries and regions, and Apple reviews 90% of submissions within 24 hours.
Looking ahead, Statista projects 143 billion Google Play downloads and 38 billion App Store downloads in 2026, roughly 181 billion combined.
iOS vs Android Market Share 2026
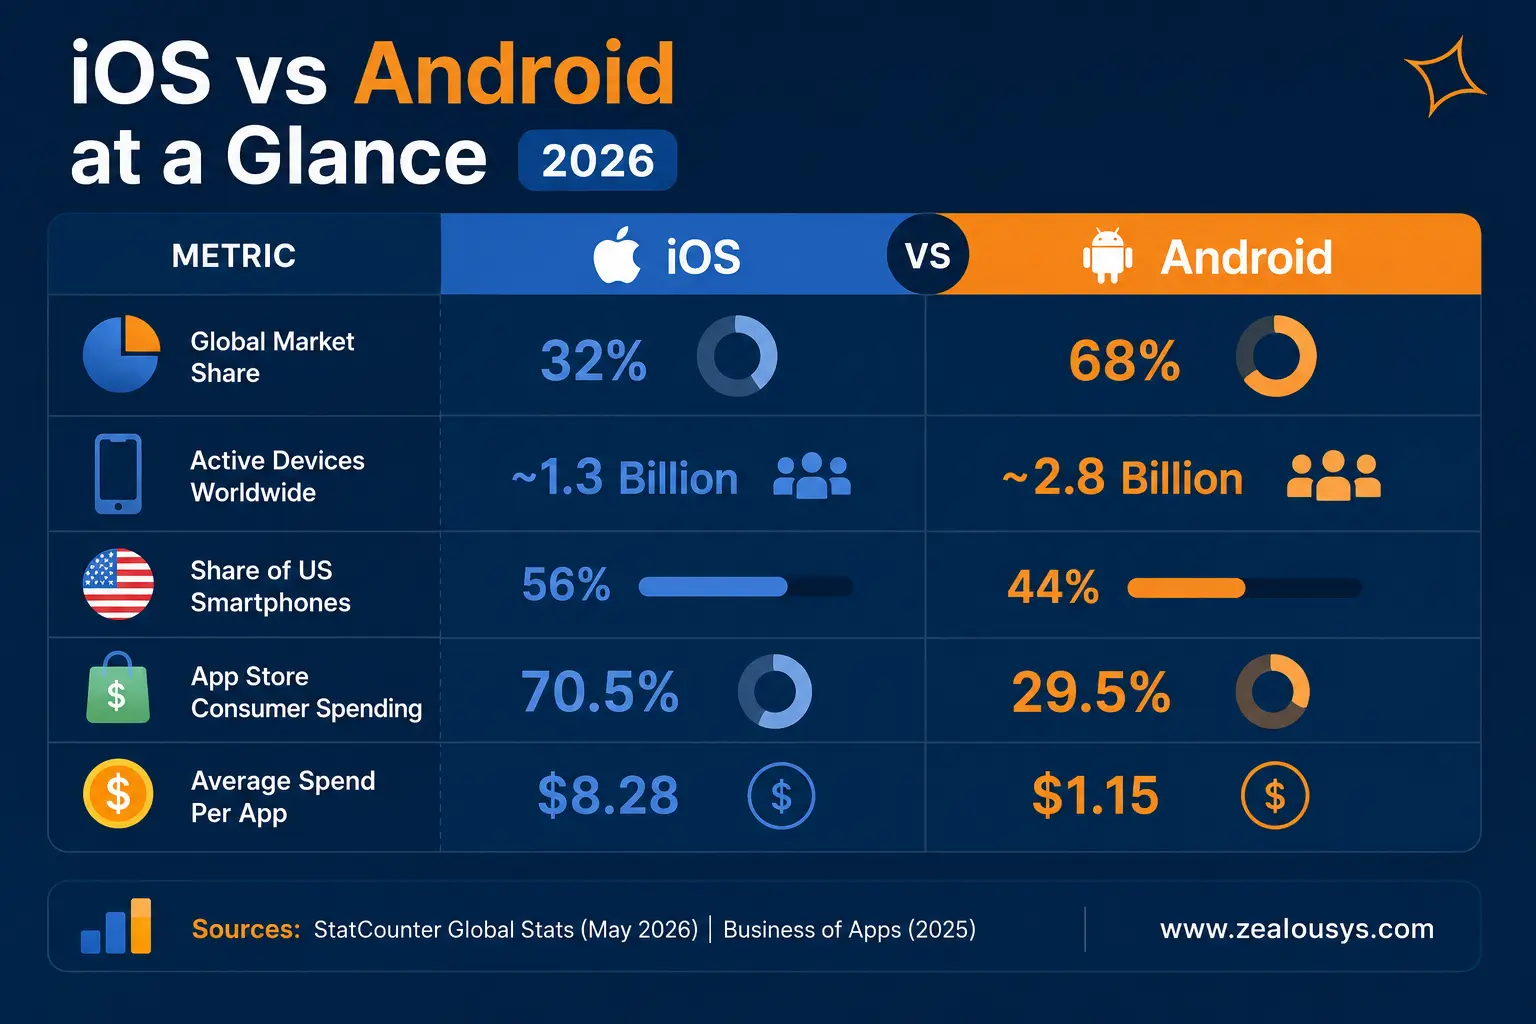
Android holds about 68% of global mobile OS share, iOS about 32%, per StatCounter data from May 2026.
Consumer spending in 2025 split $117.6 billion on the App Store versus $49.2 billion on Google Play, giving Apple about 70.5% of the combined total, per Business of Apps.
The average iPhone user spends about $1.64 per app, compared to $0.43 for Android users.
Here is the platform picture at a glance:
Metric
Android
iOS
Global OS Market Share (May 2026)
~68%
~32%
Active Devices Worldwide
3 billion+
1 billion+
US Market Share
~40%
~59.8%
2025 Store Consumer Spending
$49.2 billion
$117.6 billion
Average User Spend Per App
$0.43
$1.64
2026 Download Forecast
143 billion
38 billion
What this means for you: build Android for reach, iOS for revenue. If budget forces a single-platform launch and your model is subscription-based, the iOS-first argument remains strong in Western markets. If you are chasing users in India, Brazil, or Southeast Asia, Android is not optional.
Mobile App Revenue Statistics and Monetization Data
The story of 2025 was app monetization. Downloads barely moved, yet revenue jumped double digits. These mobile app revenue statistics show where the money actually comes from.
How Much Revenue Do Mobile Apps Generate?
Global in-app purchase revenue reached $167 billion in 2025 across the App Store and Google Play, up 10.6% year over year, with $318,000 spent every minute.
For the first time in tracking history, non-game apps ($85.6 billion) surpassed games ($81.8 billion) in consumer spending.
Non-game app spending grew 21% year over year, while games grew just 1%.
Three apps joined the billion-dollar club in 2025: ChatGPT, CapCut, and WeTV. Notably, none of them are games.
ChatGPT generated $3.4 billion in IAP revenue in 2025, ranking third among all apps behind TikTok and Google One. No app in history has reached $3 billion in annual IAP revenue faster.
Where the Money Concentrates
Social media, OTT streaming, and dating remained the largest sources of non-game IAP revenue in 2025.
Social media was the single top genre by IAP revenue, growing 16% to $15 billion as platforms like TikTok and Snapchat expanded coins, subscriptions, and one-time purchases.
ChatGPT led all apps in revenue growth at +254% year over year, with short drama app ReelShort (+115%) and CapCut (+71%) close behind.
Subscription Economics
Just over 25% of annual subscribers are still active after one year; for monthly subscriptions, only 7.6% remain, per RevenueCat data.
Business apps have the best annual subscription retention; education apps have the lowest.
What this means for you: the money has moved decisively to recurring, non-game value. If your monetization plan is “ads plus maybe some purchases later,” you are swimming against the current. Subscription-first design, with a clear recurring value proposition and a real answer to renewal-time churn, is where consumer spending lives.
App Development Cost Statistics
This is the question every founder asks first: how much does it cost to develop a mobile app? The honest answer is a range, and the range is wide, because mobile app development services are priced on scope, complexity, and team location rather than a fixed menu. Here is what the data says.
How Much Does It Cost to Develop a Mobile App?
The median cost of a professionally built custom app is approximately $171,450, according to a Clutch survey of development agencies.
A GoodFirms survey found even a simple app with minimum viable features carries a median cost of around $30,000.
Simple apps and lean MVPs typically land between $10,000 and $50,000.
Medium-complexity apps generally fall in the $50,000 to $150,000 band, stretching to $180,000 with richer UX and integrations.
Complex, feature-rich, or compliance-heavy builds routinely run $150,000 to $500,000+.
A typical mid-scope project in the US averages $80,000 to $180,000.
Most custom apps ship within 3 to 9 months; MVPs can be faster, and complex builds slower.
Design alone typically consumes 10 to 20% of the total budget, often $10,000 to $30,000 for a mid-sized project.
Ongoing and Hidden Costs
Maintenance and updates typically run 15 to 20% of the initial build cost annually.
Store fees are the cheap part: Apple charges $99 per year, and Google Play charges a one-time $25 fee, but cloud and hosting commonly run $500 to $2,000 per month as usage grows.
What this means for you: be skeptical of $5,000 quotes. They almost always assume template-heavy builds, no real QA, or scope that will balloon later. Budget for the full lifecycle: discovery, design, development, QA, launch, and at least a year of maintenance. A line-item mobile app development cost breakdown by feature and phase is worth doing before you lock scope.
Planning a mobile app but unsure what it will cost?
Here is the uncomfortable truth of mobile: most users leave fast. User retention is where app businesses live or die, and the benchmarks are humbling. Note that retention figures vary by measurement provider, so we present the two most-cited benchmark sets side by side.
Average App Retention Rate by Industry
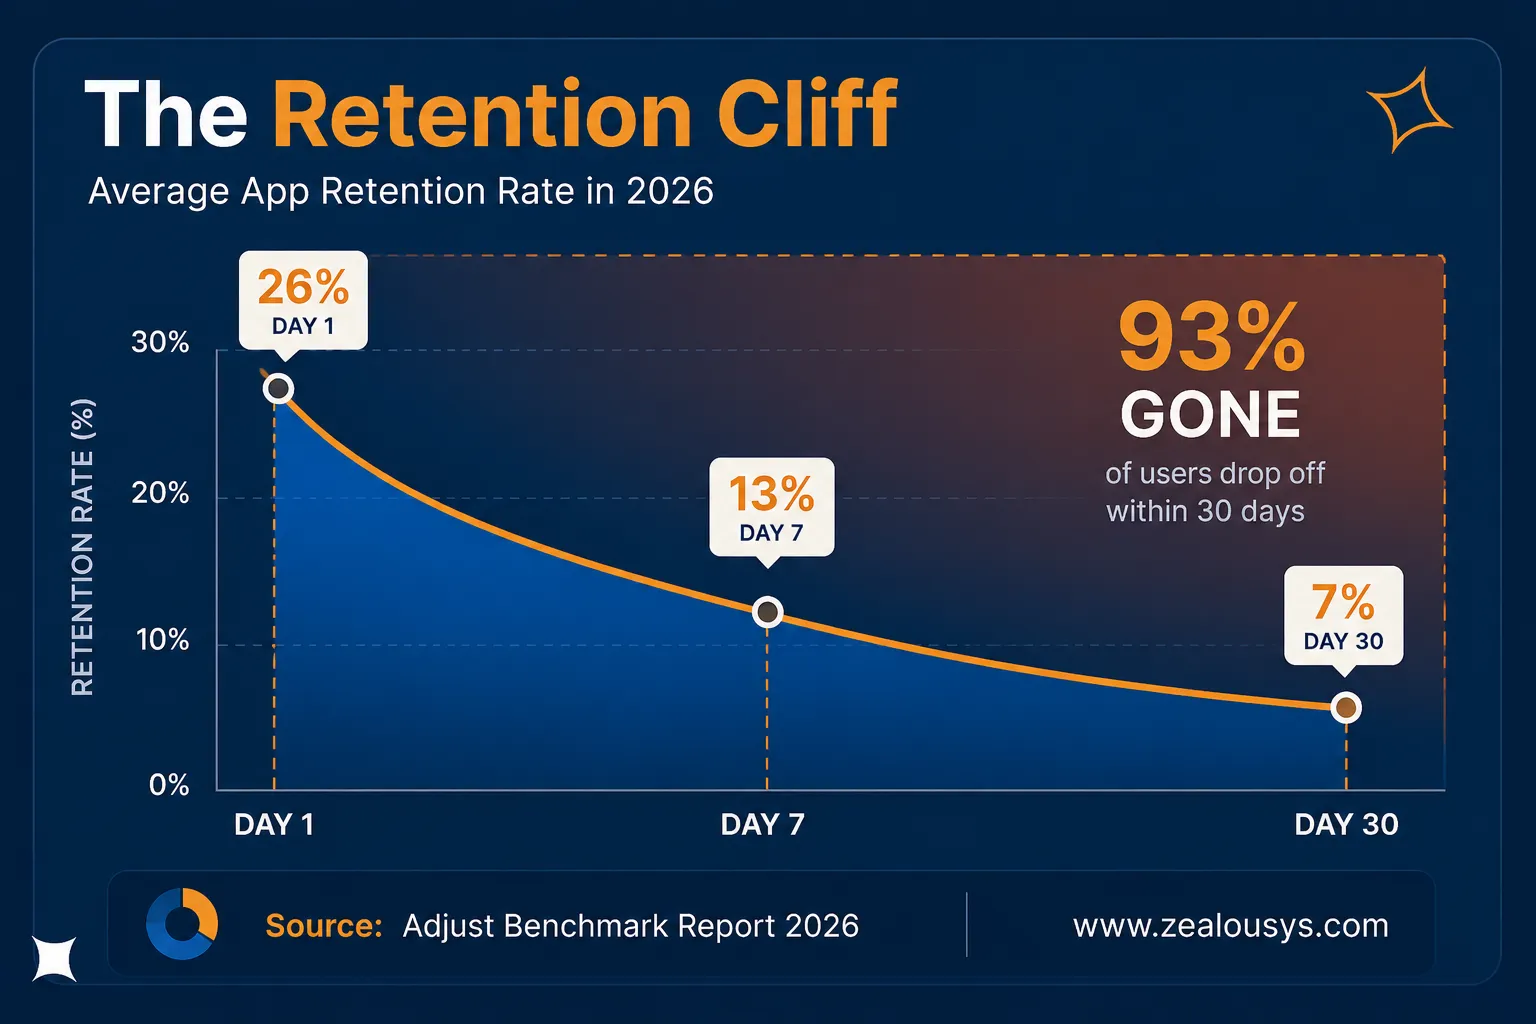
Adjust’s global benchmarks put retention at 26% on Day 1, 13% by Day 7, 10% by Day 14, and just 7% by Day 30.
On the Adjust data, iOS users are stickier: 27% on Day 1 and 8% on Day 30, versus 24% and 6% on Android.
By category, Day 30 retention for strong performers (75th percentile) breaks down as follows, per UXCam’s compilation of AppsFlyer and Adjust data. The all-category median sits far lower, at around 4%:
Category
Day 30 Retention (Strong Performers)
Social
15–20%
Productivity
12–18%
Fintech
10–15%
Streaming and Media
10–15%
Health and Fitness
8–12%
Gaming
5–8%
E-commerce
3–6%
All-Category Median
~4%
By region, gaming posts the highest Day 1 retention, sometimes 28 to 29%, while fintech’s Day 30 rate of 9% roughly doubles the all-vertical average.
Why Users Leave: Churn and Uninstall Statistics
More than 90% of users abandon an app before the 30-day mark, and even very popular mobile games churn over 80% of players.
News apps hold the highest category retention; generative AI and photo & video apps hold the lowest.
By country, Japan has the highest average retention and India the lowest.
Retaining an existing user is four to five times cheaper than acquiring a new one.
Even in games, stickiness is slipping: Sensor Tower found Day 7 retention for top casual games declined steadily from 2022 through 2025, while standouts like Tasty Travels still hold 22%.
Engagement Levers That Move the Numbers
Apps that get users to complete a meaningful first action in session one retain at 2 to 3x the rate of apps that do not, regardless of category.
Users who opt in to push notifications retain at nearly twice the rate of users who decline, per AppsFlyer data.
Top-quartile apps regularly achieve 15% or higher Day 30 retention, two to three times the industry average.
Track churn rate alongside daily active users (DAU), not instead of it: a stable DAU can mask worsening cohort retention when new installs are simply replacing the users you lost.
What this means for you: your onboarding flow is not a UI detail; it is your business model. The single most predictive metric for long-term retention is whether users complete one meaningful action in their first session. Design for that before you design anything else.
Mobile App Industry Trends Shaping 2026
Every year has its buzz. 2026 has data behind the noise. These are the mobile app industry trends actually showing up in download and revenue numbers.
Generative AI App Statistics
Generative AI app downloads doubled year over year to 3.8 billion in 2025, while IAP revenue nearly tripled to exceed $5 billion.
Time spent in generative AI apps reached 48 billion hours, roughly 3.6x the 2024 total and nearly 10x the 2023 level.
AI app sessions surpassed one trillion in 2025, with session growth outpacing downloads, a sign users are deepening engagement rather than just sampling.
AI Assistants became a top 10 subgenre by time spent (+426% year over year); AI Companion apps grew a further 68%.
The market is consolidating fast: OpenAI and DeepSeek together took nearly 50% of global AI app downloads in 2025, up from 21% in 2023, with big tech claiming another 30%.
Cross-Platform Development: Flutter and React Native Adoption
Flutter leads cross-platform framework adoption at 46% of developers versus 35% for React Native, per Statista survey data.
Flutter’s GitHub repository holds around 170,000 stars versus roughly 121,000 for React Native.
Roughly 70% of developers now favor multi-platform tools, a structural shift that directly reduces cost for two-platform launches.
Breakout Categories: Short Drama, Betting, and Quick Commerce
Short drama was the breakout format of 2025: downloads hit 2.3 billion, and in Q4 the subgenre overtook traditional OTT streaming in downloads. Category leader DramaBox grew downloads by 278%.
Short drama’s share of total video entertainment time jumped from under 1% in early 2024 to more than 10% by Q4 2025, with time spent up 311% year over year.
Sports betting app downloads grew 24% year over year globally, fueled by new markets like Brazil.
Food and drink app downloads hit a record 2.4 billion (+13%), with India surging 56% as quick commerce reached smaller cities.
Finance app downloads passed 8 billion for the first time (+6%), with credit and lending up 18% while crypto apps fell nearly 30%.
Super apps kept winning locally: Grab in Southeast Asia, Careem in the UAE, and 99 in Brazil all defended share against Uber by bundling payments and food delivery into their rideshare platforms.
What this means for you: AI features have moved from differentiator to expectation, and they monetize. At the same time, cross-platform frameworks have matured enough that “iOS and Android from one codebase” is now the default recommendation for most new consumer products, not a compromise. Whether Flutter app development or React Native development fits better usually comes down to your existing team’s skills, not the frameworks’ capabilities.
App Statistics by Industry
Category context changes everything, from realistic retention targets to monetization models. Here is a quick read on the major verticals, drawn primarily from Sensor Tower’s State of Mobile 2026 report.
Gaming
Gaming is still the single biggest spending category at $81.8 billion in IAP revenue, though growth has slowed to about 1% annually. With downloads falling, growth now depends on lifetime value: retention, reactivation, and live ops discipline rather than new-user volume.
Fintech
Downloads passed 8 billion in 2025, and the category is among the stickiest, with Day 30 retention benchmarks of 10 to 15% for strong performers, roughly double the all-category median. Utility drives habit, and habit drives retention. That stickiness is also why fintech app development justifies heavier upfront spend on security and compliance: the users you win, you tend to keep long enough to earn it back.
Health and fitness
IAP revenue climbed 13% to a record $4.5 billion on 3.96 billion downloads, with AI-powered nutrition trackers like Cal AI and outdoor platforms like Strava and AllTrails leading revenue growth. Worth separating the two lanes here: consumer wellness apps monetize on subscriptions, while regulated healthcare app development carries HIPAA and GDPR overhead that changes both timeline and budget.
Video streaming
Downloads surged 39% and revenue 18%, almost entirely on the back of the short drama boom, even as time spent in mature Western markets stagnated.
Social
Social apps absorbed nearly 2.5 trillion hours of user time in 2025, more than any other category by a wide margin, and social media became the top genre by IAP revenue at $15 billion.
E-commerce and retail
Retail app downloads declined as Temu and SHEIN’s expansion slowed under tariff pressure, and retention remains brutal: Day 30 rates of 3 to 6% are the norm even for strong performers. The app-versus-mobile-web case remains lopsided, though. Criteo’s commerce research, the original source behind most shopping-app statistics circulating online, found retail app conversion rates run three to four times higher than mobile web (18% versus 4% in the US), with about 70% of US mobile commerce happening in-app and app users browsing nearly four times more products per session than mobile web visitors. Meanwhile, generative AI referral traffic to major shopping sites grew sevenfold in a year, an early signal of how discovery is changing.
Education and e-learning
Jobs & Education apps attract the youngest audience of any category, and the vertical kept growing in 2025: language-learning leader Duolingo grew IAP revenue 21% year over year, and test prep and studying apps ranked among the top subgenres by session volume.
What These Statistics Mean for Your Business in 2026
Numbers without interpretation are just decoration. These mobile app development statistics only matter if they change what you build. Here is what we would take away if you are deciding whether and how to invest in an app this year.
1. The market rewards depth, not presence.
Download growth of 0.8% against revenue growth of 10.6% says it plainly: simply existing in the app stores earns you nothing. Apps that win convert attention into habit and habit into recurring revenue.
2. Plan your platform strategy around your revenue model, not your ego.
Android for scale, iOS for spend. If your unit economics depend on paying subscribers in North America, Japan, or Europe, iOS-first is defensible. If you need volume in India, Brazil, or Southeast Asia, start with Android. Cross-platform frameworks make “both” affordable for most budgets.
3. Budget honestly.
The realistic entry point for a quality MVP is $30,000 to $50,000, with serious products landing between $80,000 and $180,000. Add 15 to 20% annually for maintenance. Whether you build in-house or hire dedicated developers, the number that matters is total cost of ownership over three years, not the quote for version one. Underfunding QA and post-launch iteration is the most common and most expensive mistake first-time founders make.
4. Treat retention as the product.
With Day 30 retention averaging 4 to 7% depending on whose benchmark you use, the difference between a viable app and a dead one is often just the first session. Invest disproportionately in onboarding, your first meaningful user action, and push notification strategy.
5. Build AI into the value, not onto the surface.
AI app revenue nearly tripled in a year, but the winners charge for outcomes, not chatbots. ChatGPT reached $3.4 billion by doing work people would otherwise pay for. Ask what your users would pay to have done for them, then use AI to do it.
6. Respect the concentration problem.
The top 1% of publishers take 92% of revenue. Competing head-on with category leaders is a losing plan for most teams; the growth stories of 2025 (short drama, quick commerce, AI-native niches) all won by creating or catching a new behavior early rather than out-spending incumbents.
FAQ: Mobile App Development Statistics
How many apps are on the App Store in 2026?
As of mid-July 2026, 42matters’ live tracker counts roughly 2.47 million apps on the Apple App Store and 2.45 million on Google Play. Counts change daily and vary by methodology: after Google removed about 1.8 million low-quality apps, some trackers put Play’s catalog closer to 1.8 million.
How much does it cost to develop a mobile app in 2026?
Simple apps and MVPs typically cost $10,000 to $50,000. Medium-complexity apps run $50,000 to $150,000, while complex or compliance-heavy products range from $150,000 to $500,000 or more. The median for professionally developed custom apps is around $171,450, per Clutch survey data.
How much time do people spend on mobile apps daily?
The average mobile user spent 3.6 hours per day in apps during 2025, according to Sensor Tower. Globally, that added up to 5.3 trillion hours, with social media apps alone accounting for nearly 2.5 trillion of those hours, over 90 minutes per user per day.
What is a good app retention rate?
Adjust benchmarks show 26% Day 1 and 7% Day 30 retention on average; AppsFlyer data runs lower at roughly 20 to 25% and 4 to 5%. A “good” rate depends on your vertical: fintech and productivity apps retaining 10% or more of users at Day 30 outperform, and anything above 15% is top-quartile.
How much revenue do mobile apps generate?
Global in-app purchase revenue reached $167 billion in 2025, up 10.6% year over year, per Sensor Tower. Non-game apps generated $85.6 billion of that, out-earning games for the first time, driven by generative AI, social media, streaming, and productivity subscriptions.
Conclusion
The 2026 picture these mobile app development statistics paint is clear enough to act on. Mobile is no longer a growth story about more users and more downloads. It is a monetization story, won by teams that understand platform economics, budget realistically, and obsess over the first five minutes of the user experience.
The gap between average and excellent has never been wider. Average apps lose more than 90% of their users in a month. Excellent ones retain at triple that rate, ride recurring revenue to durable businesses, and increasingly use AI to deliver outcomes users will pay for.
If you are weighing an app investment and want a grounded read on scope, cost, and platform strategy for your specific idea, the team at Zealous System has spent years turning exactly these numbers into working products. A short conversation with our consultants can save you months of expensive guesswork.
Ready to turn these statistics into your mobile app strategy?
Raj Kewlani is a Project Manager and Mobile & Open Source Development Lead at Zealous System, specializing in agile-driven digital solutions. He focuses on delivering high-quality mobile apps and open-source projects that align with business goals.




Comments